Research Article 
![]() Creative Commons, CC-BY
Creative Commons, CC-BY
The model of Brain Neurodegeneration based on Plykin - Newhouse attractor with Sinusoidal Force
*Corresponding author: Sergey Belyakin, Department of General Physics, Physics Faculty, Lomonosov Moscow State University, Moscow, Russia.
Received: August 16, 2022; Published: August 30, 2022
DOI: 10.34297/AJBSR.2022.17.002305
Abstract
A nonlinear dynamic model on a spherical surface is considered, which generates the Plikin-Newhouse attractor. The influence of an external sinusoidal action on the system is studied, the time dependences of dynamic quantities and phase trajectories are obtained for various amplitudes of the external action. The results obtained show that the distribution of the density of phase trajectories is close to the typical distribution of neuronal activity in the brain. With an increase in the amplitude of exposure, the distribution evolves from a distribution typical of a healthy brain to a distribution characteristic of neuronal degeneration.
Keywords: Neurodegeneration, neurons, chaotic dynamic, the attractor of the Plykin - Newhouse, periodic sinusoidal electro-stimulation, hyperbolicity.
Introduction
In mathematical theory of dynamical systems, a class of uniformly hyperbolic strange attractors is known. In such an attractor all orbits are of the same saddle type, they manifest strong stochastic properties and allow detailed theoretical analysis. In textbooks and reviews, examples of these attractors are traditionally represented by abstract artificial constructions like the Plykin attractor and the Smale - William’s attractor. The simplest attractor of Plykin type is constructed with mapping of a domain of a plane with holes into itself. To construct a system with the Plykin attractor let us start with a map of a unit sphere defined as a sequence of four periodically repeating stages of continuous transformations. Duration of each stage is taken to be equal to a unit time interval. The holes will correspond to neighborhoods of four points A, B, C, D on the spere. Let us define the first stage as a flow of the representative points along circles of lattitude away from the meridians AB and DC. The second stage is differential rotation around z-axis with angular velocity depending on z linearly, in such way that the points B and C do not move, while the points A and D exchange their location. The third and the fourth stages are similar to the prevous two but differ in the spatial orientation: the axes x and z exchange their roles. The figure 1 illustrates the the transformations geometrically, and differential equations for all the stages are written down [1].
Hyperbolic Plykin - Newhouse attractor on a spherical surface
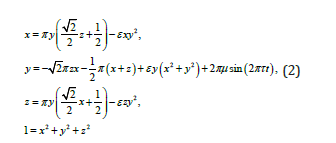
The realization of a Hyperbolic Plykin - Newhouse attractor on a sphere is represented by the equation [2] (1).

The realization of a Hyperbolic Plykin - Newhouse attractor on a sphere is represented by figure 2 &3.
Figure 2 shows the temporal dynamics of y(t) of hyperbolic Plykin - Newhouse attractor on a spherical surface if ε = 0.72. Figure 3 left shows temporal dynamics of y(t) and the Fourier spectrum on the right presents the temporal dynamics of y(x) and wavelet transform hyperbolic Plykin - Newhouse attractor on a spherical surface if ε = 0.72. Hyperbolic Plykin - Newhouse attractor on a spherical surface in figure 2 and figure 3 show the bifurcation and chaotic.

Figure 1: Implementation of an Smale - William’s attractor on a sphere, the Plykin - Newhouse attractor.

Figure 2: Presents the temporal dynamics of x(t), y(t) & z(t) of hyperbolic Plykin - Newhouse attractor on a spherical surface if ε = 0.72.

Figure 3: Presents the temporal dynamics of x(y), z(y) & z(x) of hyperbolic Plykin - Newhouse attractor on a spherical surface if ε = 0.72.
We apply the model of temporary periodic sinusoidal electro-stimulation for hyperbolic Plykin - Newhouse attractor on a spherical surface
For control and synchronization of hyperbolic Plykin - Newhouse attractor on a spherical surface we apply the method of temporary periodic sinusoidal electro-stimulation [3] by the equation (2).
For dynamics (μ/ τ) of hyperbolic Plykin - Newhouse attractor on a spherical surface we apply the method of temporary periodic sinusoidal electro-stimulation by figure 4. The right graphs show the dynamics with positive parameters μ. Blue color is stable dynamics, yellow color is not stable dynamics, red color is chaotic dynamics.
Displaying analogies between a mathematical model and waves on the surface of the Brain
(Figure 5)

Figure 4: The left graph shows the dynamics with parameters μ.

Figure 5: Milestone charts Timeline y(t) and phase portraits y(x) of the attractor Plykin - Newhouse. Lower graphs Electroencephalogram and Brain Perfusion.
Differentiated model
In equation (1) the first and third equations are symmetric, the method of differentiation equation (3) is applicable to equation (1).
A positive impact on the attractor the attractor translates the pole on the positive sector of the equator. Attractor points A, B, C and D closer together forming a stable periodic attractor.
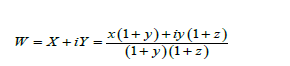
Figure 6 & 7 shows on the left the temporal scale amplitude Z(t), to the right of the phase portrait of Y(X), in the absence of external influence on the attractor. It is easy to see that, at these parameter values the attractor has strong chaotic properties. We apply the differential equation (3) to equation (2) and obtain equation (4)
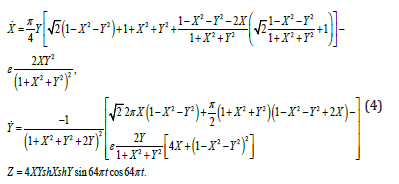
Here X, Y - dynamic variables, ε - coefficient of connection. Phase portraits of Y(X) of the Plykin - Newhouse attractor when figure 6 & 7.

Figure 6: Phase portraits of Y(X) of the Plykin - Newhouse attractor when μ = 0.1 → 1.0, τ = 1.0, ε = 0.72.

Figure 7: Milestone charts Timeline of Z(t) of the Plykin - Newhouse attractor when μ = 0.1 → 1.0, 2.0, τ = 1.0, ε = 0.72.
Figure 6 shows on the left the temporal scale amplitude y(t), to the right of the phase portrait of y(x), in the absence of external influence on the attractor. It is easy to see that, at these parameter values the attractor has strong chaotic properties.
When using the method of temporary periodic sinusoidal electro-stimulation μ = 0.1→1.0, ε = 0.72, τ = 1.9 is observed evolutionary dynamics of phase portraits of the system shown in figure 6.
When using the method of temporary periodic sinusoidal electro-stimulation μ = 0.1→ 1.0, 2.0, ε = 0.72, τ = 1.9 is observed evolutionary dynamics of soliton, phase portraits of the system shown in figure 7.
The hyperbolic attractor degenerates into the limiting cycle, and the continuous spectrum corresponding to chaotic oscillations changes into an equidistant one with the frequencies corresponding to the basic frequency and its harmonics. Thus, the application of the method of temporary periodic sinusoidal electro-stimulation at a constant time delay, gives the opportunity to observe the evolutionary dynamics of systems of hyperbolic Plykin - Newhouse attractor [3].
Result
In the case of exposure to μ (0-1), the change of state from unstable to stable occurs evolutionarily figure 6. In the case of exposure to μ (1-2), the change of state from stable to unstable occurs by a jump figure 7.
The right graph of figure 8 of the positive scan corresponds to the first graph of figure 3. The negative scan of the left figure 8 where the red spots are located corresponds to the fifth graphs of figure 6&7.

Figure 8:Neurodegenerative and healthy state of the human brain
Currently, it has become fashionable to identify the human brain with an array of neural network databases Figure 9 [4], although real networks look much more complicated Figure10 [5].

Figure 9: 3D visualization of the brain and its computer processing of data arrays of neural networks.

Figure 10:A real neural network of the upper part of the brain.
Conclusions
This report uses an autonomous physical system, which is represented by a Smale Williams hyperbolic type attractor. Dynamics and evolution of neurodegeneration. The attractor model of Plykin- Newkhoz is applied using the method of temporary periodic sinusoidal electro-stimulation. If the considered mathematical model really corresponds to the neural processes of the brain, the results obtained show that weak electrical stimulation can normalize the state of the brain. On the contrary, strong electrical stimulation worsens his condition and can lead to brain stoppage.
References
- SP Kuznetsov (2009) “Hyperbolic strange attractors of physically realizable systems." Problems of nonlinear dynamics. 17(4).
- SP Kuznetsov (2009) "An example of a non-autonomous continuous-time system with attractor of Plykin type in the Poincare map." Non. dyn. 5(4): 403-424.
- S Belyakin, S Shuteev and S Kyznetsov (2018) "Evolution controlling of the Plykin - Newhouse attractor by the Pyragas method." Journal of Nanoscience and Nanotechnology Applications. 2(2):1-6.
- S Belyakin and S Shuteev (2021)" Classical soliton theory for studying the dynamics and evolution of in network." Advances in Theoretical & Computational Physics. 4(3): 228-230.
- S Belyakin and S Shuteev (2021)"Replacement of damaged active and inactive axons in neurons taking into account chirality with multilayer mesh electrically conductive nanotubes." Polish journal of science 1(45): 37-42.


 We use cookies to ensure you get the best experience on our website.